April 2, 2026, General news
Hydro-Québec announces new grant to accelerate solar self-generation
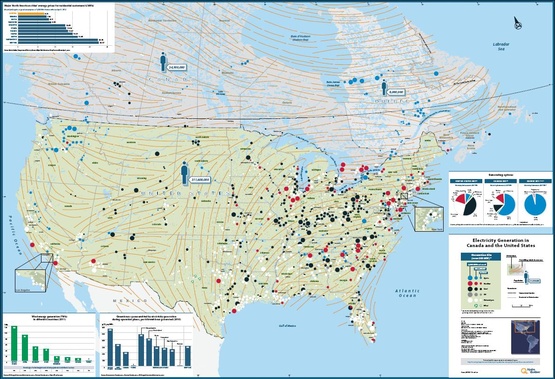
How is electricity generated in Canada and the United States and how does Québec’s output compare with that of its neighbors? To provide a visual representation of the answers to these questions, Hydro-Québec has published the 5th edition of a map  illustrating the different generating options used in Canada and the United States. This map also includes data related to power generation.
Resources used to generate power
- In 2011, over 97% of the power generated in Québec was from renewable sources, compared with 63% in Canada and 12% in the US.
- In the US, coal is still the main resource used to generate power (42%), while water tops the list in Canada and Québec, accounting for 60% and 96% of total output, respectively.
- In 2011, wind power accounted for 3% of total output in the US, compared with 2% in Canada and 1% in Québec. The US is the largest wind power producer in the world.
Greenhouse gas emissions from power generation
- In 2010, Québec’s greenhouse gas (GHG) emissions from power generation, per kilowatthour produced, were 280 times lower than those of the US, 165 times lower than those of the New England states and 100 times lower than those of Canada as a whole.
- Québec’s GHG emissions from power generation are comparable to those of Vermont. Québec has the lowest GHG emissions from power generation, per kilowatthour produced, in Canada, and the same holds true for Vermont in the US.
Map and Animated presentation
Relations with the media
Hydro-Québec
April 2, 2026, General news
Hydro-Québec announces new grant to accelerate solar self-generation
March 27, 2026, Montréal
Hydro-Québec to reinforce the grid and increase capacity at Saint-Jean substation
March 25, 2026, General news
Hydro-Québec launches Request for Information to inform potential development of offshore wind farms off Nova Scotia